Recently Updated

Elasticsearch Elastic Agent and Kibana

Background
What do you think when you think about custom log integrations? So sometimes it’s great to be able to take loads of data and condense them into a visualized queryable form. What I find the technology particularly usefor for, since I run things under constant attack such as this information security oriented blog, TOR nodes, as well as my own home network, is log analysis. But logs are boring right? Well, sometimes. Here’s where an ELK stack comes in. Custom log integrations in elastic turn things beautiful.
Here I’ll be showing you how I take logs from my offsite servers using elastic agent, and collate them onto another box, specifically used for logging. For this we’ll use a combination of mainly three technologies, Elasticsearch, Logstash, and Kibana.
In this tutorial pulling the logs can be handled with elasticsearch and elastic-agent alone, so we’ll use those to save on overhead instead of piggybacking Logstash.
I’ll be using the Suricata IPS setup from this walkthrough for the logs.
Installation of binaries
First we need to install the binaries that will build our ELK stack.
(on the logging server)
wget -qO - https://artifacts.elastic.co/GPG-KEY-elasticsearch | sudo apt-key add -
sudo apt-get install apt-transport-https
echo "deb https://artifacts.elastic.co/packages/7.x/apt stable main" | sudo tee -a /etc/apt/sources.list.d/elastic-7.x.list
sudo apt-get update
sudo apt-get install logstash kibana elasticsearch elastic-agent
(on an external server)
wget -qO - https://artifacts.elastic.co/GPG-KEY-elasticsearch | sudo apt-key add -
sudo apt-get install apt-transport-https
echo "deb https://artifacts.elastic.co/packages/7.x/apt stable main" | sudo tee -a /etc/apt/sources.list.d/elastic-7.x.list
sudo apt-get update
sudo apt-get install elastic-agent
Now on the logging server you’ll want to setup the following files:
ElasticSearch’s config:
/etc/elasticsearch/elasticsearch.yml
cluster.name: oxagast.org                      # change for your cluster
node.name: jerkon                              # change for this server
path.data: /var/lib/elasticsearch
path.logs: /var/log/elasticsearch
network.host: 10.8.0.2                         # change for your environment
http.port: 9200
discovery.seed_hosts: ["10.8.0.2", "10.8.0.1"] # change hosts
xpack.security.enabled: true
xpack.security.authc.api_key.enabled: true
xpack.security.transport.ssl.enabled: true
As well as kibana’s:
/etc/kibana/kibana.yml
elasticsearch.hosts: ["http://10.8.0.2:9200"]  # change this for your environment
elasticsearch.username: "elastic"
elasticsearch.password: "yourpass"             # change this
Now change the login information with:
/usr/share/elasticsearch/bin/elasticsearch-setup-passwords interactiveNow you should restart elasticsearch and kibana with:
sudo systemctl restart elasticsearch
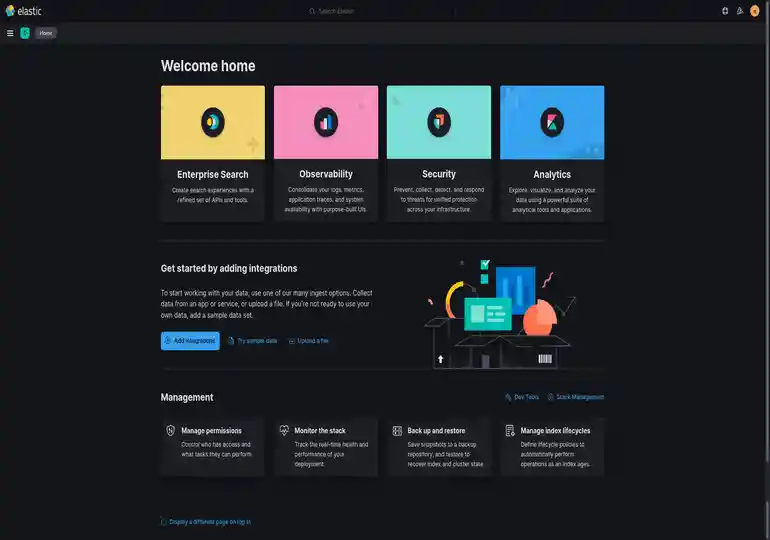
sudo systemctl restart kibanaThen browse to kibana in your browser, which should be running on localhost:5601.
You should now be greeted with a login screen (if you setup the passwords), so log in, and you’ll see something like:
Now you should navigate in kibana to Integrations, under Management in the context menu to the top left.
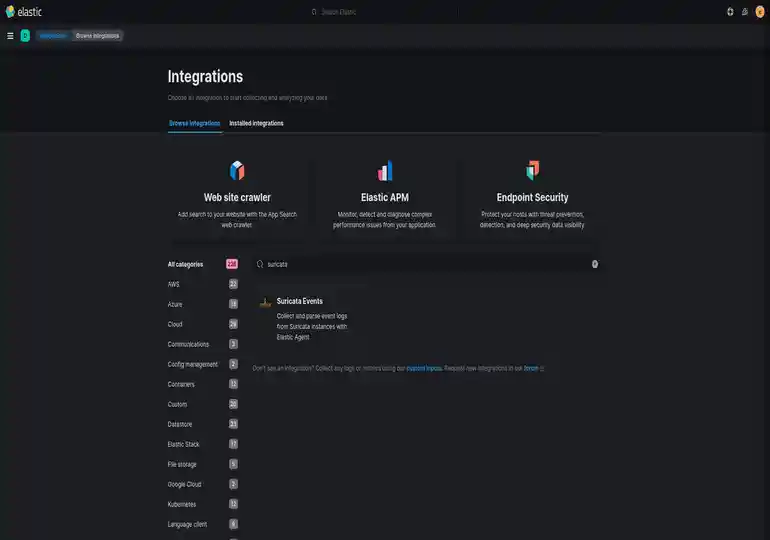
Then you’ll want to click Add Suricata Events, click Save and Continue, then click Add Agent to your Hosts. Now go to the Run Standalone tab and Copy to Clipboard above the data it generates to add to your log file.
Now you should be able to go to the external server and edit:
/etc/elastic-agent/elastic-agent.yml
id: 2016d7cc-135e-5583-9758-3ba01f5a06e5
revision: 9
outputs:
default:
type: elasticsearch
hosts:
- 'http://localhost:9200' # you may need to edit this
username: 'elastic' # you may need to edit this too
password: 'yourpass' # you do need to edit this
output_permissions:
default:
_elastic_agent_monitoring:
indices:
- names:
- metrics-elastic_agent.apm_server-default
privileges:
- auto_configure
- create_doc
- names:
- logs-elastic_agent.fleet_server-default
privileges:
- auto_configure
- create_doc
- names:
- metrics-elastic_agent.elastic_agent-default
privileges:
- auto_configure
- create_doc
- names:
- metrics-elastic_agent.endpoint_security-default
privileges:
- auto_configure
- create_doc
- names:
- logs-elastic_agent.apm_server-default
privileges:
- auto_configure
- create_doc
- names:
- metrics-elastic_agent.fleet_server-default
privileges:
- auto_configure
- create_doc
- names:
- metrics-elastic_agent.osquerybeat-default
privileges:
- auto_configure
- create_doc
- names:
- metrics-elastic_agent.metricbeat-default
privileges:
- auto_configure
- create_doc
- names:
- metrics-elastic_agent.auditbeat-default
privileges:
- auto_configure
- create_doc
- names:
- logs-elastic_agent.filebeat-default
privileges:
- auto_configure
- create_doc
- names:
- logs-elastic_agent.auditbeat-default
privileges:
- auto_configure
- create_doc
- names:
- logs-elastic_agent.endpoint_security-default
privileges:
- auto_configure
- create_doc
- names:
- logs-elastic_agent-default
privileges:
- auto_configure
- create_doc
- names:
- logs-elastic_agent.packetbeat-default
privileges:
- auto_configure
- create_doc
- names:
- logs-elastic_agent.heartbeat-default
privileges:
- auto_configure
- create_doc
- names:
- logs-elastic_agent.osquerybeat-default
privileges:
- auto_configure
- create_doc
- names:
- metrics-elastic_agent.packetbeat-default
privileges:
- auto_configure
- create_doc
- names:
- logs-elastic_agent.metricbeat-default
privileges:
- auto_configure
- create_doc
- names:
- metrics-elastic_agent.heartbeat-default
privileges:
- auto_configure
- create_doc
- names:
- metrics-elastic_agent.filebeat-default
privileges:
- auto_configure
- create_doc
_elastic_agent_checks:
cluster:
- monitor
system-1:
indices:
- names:
- logs-system.auth-default
privileges:
- auto_configure
- create_doc
- names:
- logs-system.syslog-default
privileges:
- auto_configure
- create_doc
- names:
- logs-system.application-default
privileges:
- auto_configure
- create_doc
- names:
- logs-system.security-default
privileges:
- auto_configure
- create_doc
- names:
- logs-system.system-default
privileges:
- auto_configure
- create_doc
- names:
- metrics-system.cpu-default
privileges:
- auto_configure
- create_doc
- names:
- metrics-system.diskio-default
privileges:
- auto_configure
- create_doc
- names:
- metrics-system.filesystem-default
privileges:
- auto_configure
- create_doc
- names:
- metrics-system.fsstat-default
privileges:
- auto_configure
- create_doc
- names:
- metrics-system.load-default
privileges:
- auto_configure
- create_doc
- names:
- metrics-system.memory-default
privileges:
- auto_configure
- create_doc
- names:
- metrics-system.network-default
privileges:
- auto_configure
- create_doc
- names:
- metrics-system.process-default
privileges:
- auto_configure
- create_doc
- names:
- metrics-system.process.summary-default
privileges:
- auto_configure
- create_doc
- names:
- metrics-system.socket_summary-default
privileges:
- auto_configure
- create_doc
- names:
- metrics-system.uptime-default
privileges:
- auto_configure
- create_doc
linux-1:
indices:
- names:
- metrics-linux.network_summary-default
privileges:
- auto_configure
- create_doc
- names:
- metrics-linux.iostat-default
privileges:
- auto_configure
- create_doc
- names:
- metrics-linux.memory-default
privileges:
- auto_configure
- create_doc
osquery_manager-1:
indices:
- names:
- logs-osquery_manager.result-default
privileges:
- auto_configure
- create_doc
suricata-1:
indices:
- names:
- logs-suricata.eve-default
privileges:
- auto_configure
- create_doc
apache-1:
indices:
- names:
- logs-apache.access-default
privileges:
- auto_configure
- create_doc
- names:
- logs-apache.error-default
privileges:
- auto_configure
- create_doc
- names:
- metrics-apache.status-default
privileges:
- auto_configure
- create_doc
suricata-2:
indices:
- names:
- logs-suricata.eve-default
privileges:
- auto_configure
- create_doc
agent:
monitoring:
enabled: true
use_output: default
namespace: default
logs: true
metrics: true
inputs:
- id: default-system-policy
name: system-1
revision: 1
type: logfile
use_output: default
meta:
package:
name: system
version: 1.6.4
data_stream:
namespace: default
streams:
- id: logfile-system.auth-default-system-policy
data_stream:
dataset: system.auth
type: logs
paths:
- /var/log/auth.log*
- /var/log/secure*
exclude_files:
- .gz$
multiline:
pattern: ^\s
match: after
processors:
- add_locale: null
- id: logfile-system.syslog-default-system-policy
data_stream:
dataset: system.syslog
type: logs
paths:
- /var/log/messages*
- /var/log/syslog*
exclude_files:
- .gz$
multiline:
pattern: ^\s
match: after
processors:
- add_locale: null
- id: default-system-policy
name: system-1
revision: 1
type: winlog
use_output: default
meta:
package:
name: system
version: 1.6.4
data_stream:
namespace: default
streams:
- id: winlog-system.application-default-system-policy
name: Application
data_stream:
dataset: system.application
type: logs
condition: '${host.platform} == ''windows'''
ignore_older: 72h
tags: null
- id: winlog-system.security-default-system-policy
name: Security
data_stream:
dataset: system.security
type: logs
condition: '${host.platform} == ''windows'''
tags: null
- id: winlog-system.system-default-system-policy
name: System
data_stream:
dataset: system.system
type: logs
condition: '${host.platform} == ''windows'''
tags: null
- id: default-system-policy
name: system-1
revision: 1
type: system/metrics
use_output: default
meta:
package:
name: system
version: 1.6.4
data_stream:
namespace: default
streams:
- id: system/metrics-system.cpu-default-system-policy
data_stream:
dataset: system.cpu
type: metrics
metricsets:
- cpu
cpu.metrics:
- percentages
- normalized_percentages
period: 10s
- id: system/metrics-system.diskio-default-system-policy
data_stream:
dataset: system.diskio
type: metrics
metricsets:
- diskio
diskio.include_devices: null
period: 10s
- id: system/metrics-system.filesystem-default-system-policy
data_stream:
dataset: system.filesystem
type: metrics
metricsets:
- filesystem
period: 1m
processors:
- drop_event.when.regexp:
system.filesystem.mount_point: ^/(sys|cgroup|proc|dev|etc|host|lib|snap)($|/)
- id: system/metrics-system.fsstat-default-system-policy
data_stream:
dataset: system.fsstat
type: metrics
metricsets:
- fsstat
period: 1m
processors:
- drop_event.when.regexp:
system.fsstat.mount_point: ^/(sys|cgroup|proc|dev|etc|host|lib|snap)($|/)
- id: system/metrics-system.load-default-system-policy
data_stream:
dataset: system.load
type: metrics
metricsets:
- load
condition: '${host.platform} != ''windows'''
period: 10s
- id: system/metrics-system.memory-default-system-policy
data_stream:
dataset: system.memory
type: metrics
metricsets:
- memory
period: 10s
- id: system/metrics-system.network-default-system-policy
data_stream:
dataset: system.network
type: metrics
metricsets:
- network
period: 10s
network.interfaces: null
- id: system/metrics-system.process-default-system-policy
data_stream:
dataset: system.process
type: metrics
metricsets:
- process
period: 10s
process.include_top_n.by_cpu: 5
process.include_top_n.by_memory: 5
process.cmdline.cache.enabled: true
process.cgroups.enabled: false
process.include_cpu_ticks: false
processes:
- .*
- id: system/metrics-system.process.summary-default-system-policy
data_stream:
dataset: system.process.summary
type: metrics
metricsets:
- process_summary
period: 10s
- id: system/metrics-system.socket_summary-default-system-policy
data_stream:
dataset: system.socket_summary
type: metrics
metricsets:
- socket_summary
period: 10s
- id: system/metrics-system.uptime-default-system-policy
data_stream:
dataset: system.uptime
type: metrics
metricsets:
- uptime
period: 10s
- id: 08baa17f-11bb-4b3b-82d6-d2003b837e61
name: linux-1
revision: 1
type: system/metrics
use_output: default
meta:
package:
name: linux
version: 0.4.1
data_stream:
namespace: default
streams:
- id: >-
system/metrics-linux.network_summary-08baa17f-11bb-4b3b-82d6-d2003b837e61
data_stream:
dataset: linux.network_summary
type: metrics
metricsets:
- network_summary
condition: '${host.platform} == ''linux'''
period: 10s
processors:
- drop_fields:
fields: event.module
- id: 08baa17f-11bb-4b3b-82d6-d2003b837e61
name: linux-1
revision: 1
type: linux/metrics
use_output: default
meta:
package:
name: linux
version: 0.4.1
data_stream:
namespace: default
streams:
- id: linux/metrics-linux.iostat-08baa17f-11bb-4b3b-82d6-d2003b837e61
data_stream:
dataset: linux.iostat
type: metrics
metricsets:
- iostat
condition: '${host.platform} == ''linux'''
period: 10s
- id: linux/metrics-linux.memory-08baa17f-11bb-4b3b-82d6-d2003b837e61
data_stream:
dataset: linux.memory
type: metrics
metricsets:
- memory
condition: '${host.platform} == ''linux'''
period: 10s
- id: ac424824-b743-4cbd-aa7c-c85253959e80
name: osquery_manager-1
revision: 1
type: osquery
use_output: default
meta:
package:
name: osquery_manager
version: 0.8.0
data_stream:
namespace: default
- id: 48c17968-7494-4d3c-bced-38e11a5eeb31
name: suricata-1
revision: 2
type: logfile
use_output: default
meta:
package:
name: suricata
version: 1.3.2
data_stream:
namespace: default
streams:
- id: logfile-suricata.eve-48c17968-7494-4d3c-bced-38e11a5eeb31
data_stream:
dataset: suricata.eve
type: logs
exclude_files:
- .gz$
paths:
- /var/log/suricata/eve.json
tags:
- forwarded
- suricata-eve
publisher_pipeline.disable_host: true
- id: 59316981-f425-44e0-b42b-d86c48824146
name: apache-1
revision: 1
type: logfile
use_output: default
meta:
package:
name: apache
version: 1.3.2
data_stream:
namespace: default
streams:
- id: logfile-apache.access-59316981-f425-44e0-b42b-d86c48824146
data_stream:
dataset: apache.access
type: logs
paths:
- /var/log/apache2/access.log*
- /var/log/apache2/other_vhosts_access.log*
- /var/log/httpd/access_log*
tags:
- apache-access
exclude_files:
- .gz$
- id: logfile-apache.error-59316981-f425-44e0-b42b-d86c48824146
data_stream:
dataset: apache.error
type: logs
paths:
- /var/log/apache2/error.log*
- /var/log/httpd/error_log*
exclude_files:
- .gz$
tags:
- apache-error
processors:
- add_locale: null
- id: 59316981-f425-44e0-b42b-d86c48824146
name: apache-1
revision: 1
type: apache/metrics
use_output: default
meta:
package:
name: apache
version: 1.3.2
data_stream:
namespace: default
streams:
- id: apache/metrics-apache.status-59316981-f425-44e0-b42b-d86c48824146
data_stream:
dataset: apache.status
type: metrics
metricsets:
- status
hosts:
- 'http://127.0.0.1'
period: 30s
server_status_path: /server-status
- id: f6bbf581-a639-42d2-8e7a-93e65f446841
name: suricata-2
revision: 1
type: logfile
use_output: default
meta:
package:
name: suricata
version: 1.3.2
data_stream:
namespace: default
streams:
- id: logfile-suricata.eve-f6bbf581-a639-42d2-8e7a-93e65f446841
data_stream:
dataset: suricata.eve
type: logs
paths:
- /var/log/suricata/eve.json
exclude_files:
- .gz$
tags:
- forwarded
- suricata-eve
publisher_pipeline.disable_host: trueNow restart elastic-agent with:
systemctl restart elastic-agentNote: you can add any integrations you want, but you’ll need to edit this
file again and systemctl restart elastic-agent to make it work.
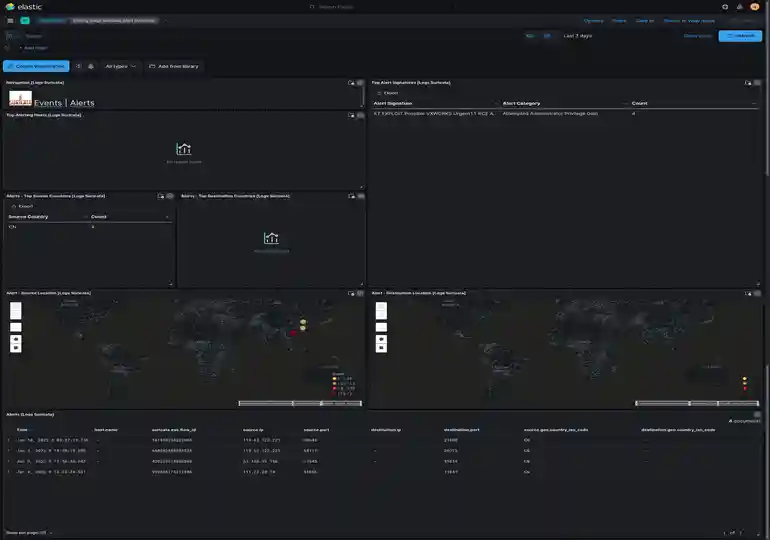
You can now pull up the Suricata Logs by going to Dashboard in the context menu and finding Suricata logs.
Once you bring it up:
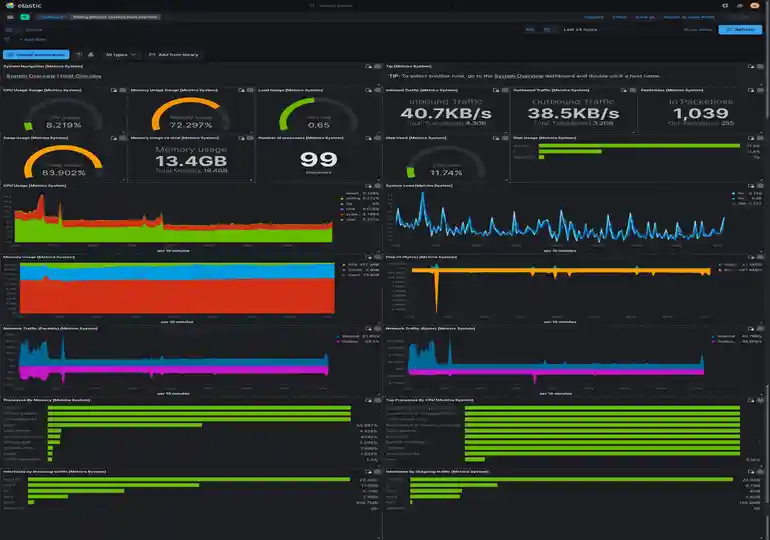
You can also (if you install OS Metrics) see things like system load of all the hosts you’ve added to your cluster:
Conclusion
Now our logs are beautiful!
Hope you’ve enjoyed my crash course in log monitoring with Elastic Stacks. You can keep adding known things from elastic-agent, or you can even fall back to using logstash to parse custom logs.
Happy playing catch the hacker! (Hopefully it won’t be me!)
If you enjoy my work, sponsor or hire me! I work hard keeping oxasploits running!
Bitcoin Address:
bc1qx4suwsawn0dcfvdg7qxpxv3je6ke0rcl9naey4
Thank you so much and happy hacking!
This post is licensed under
CC BY 4.0
by the author.